By Vizzuality & Impact Observatory
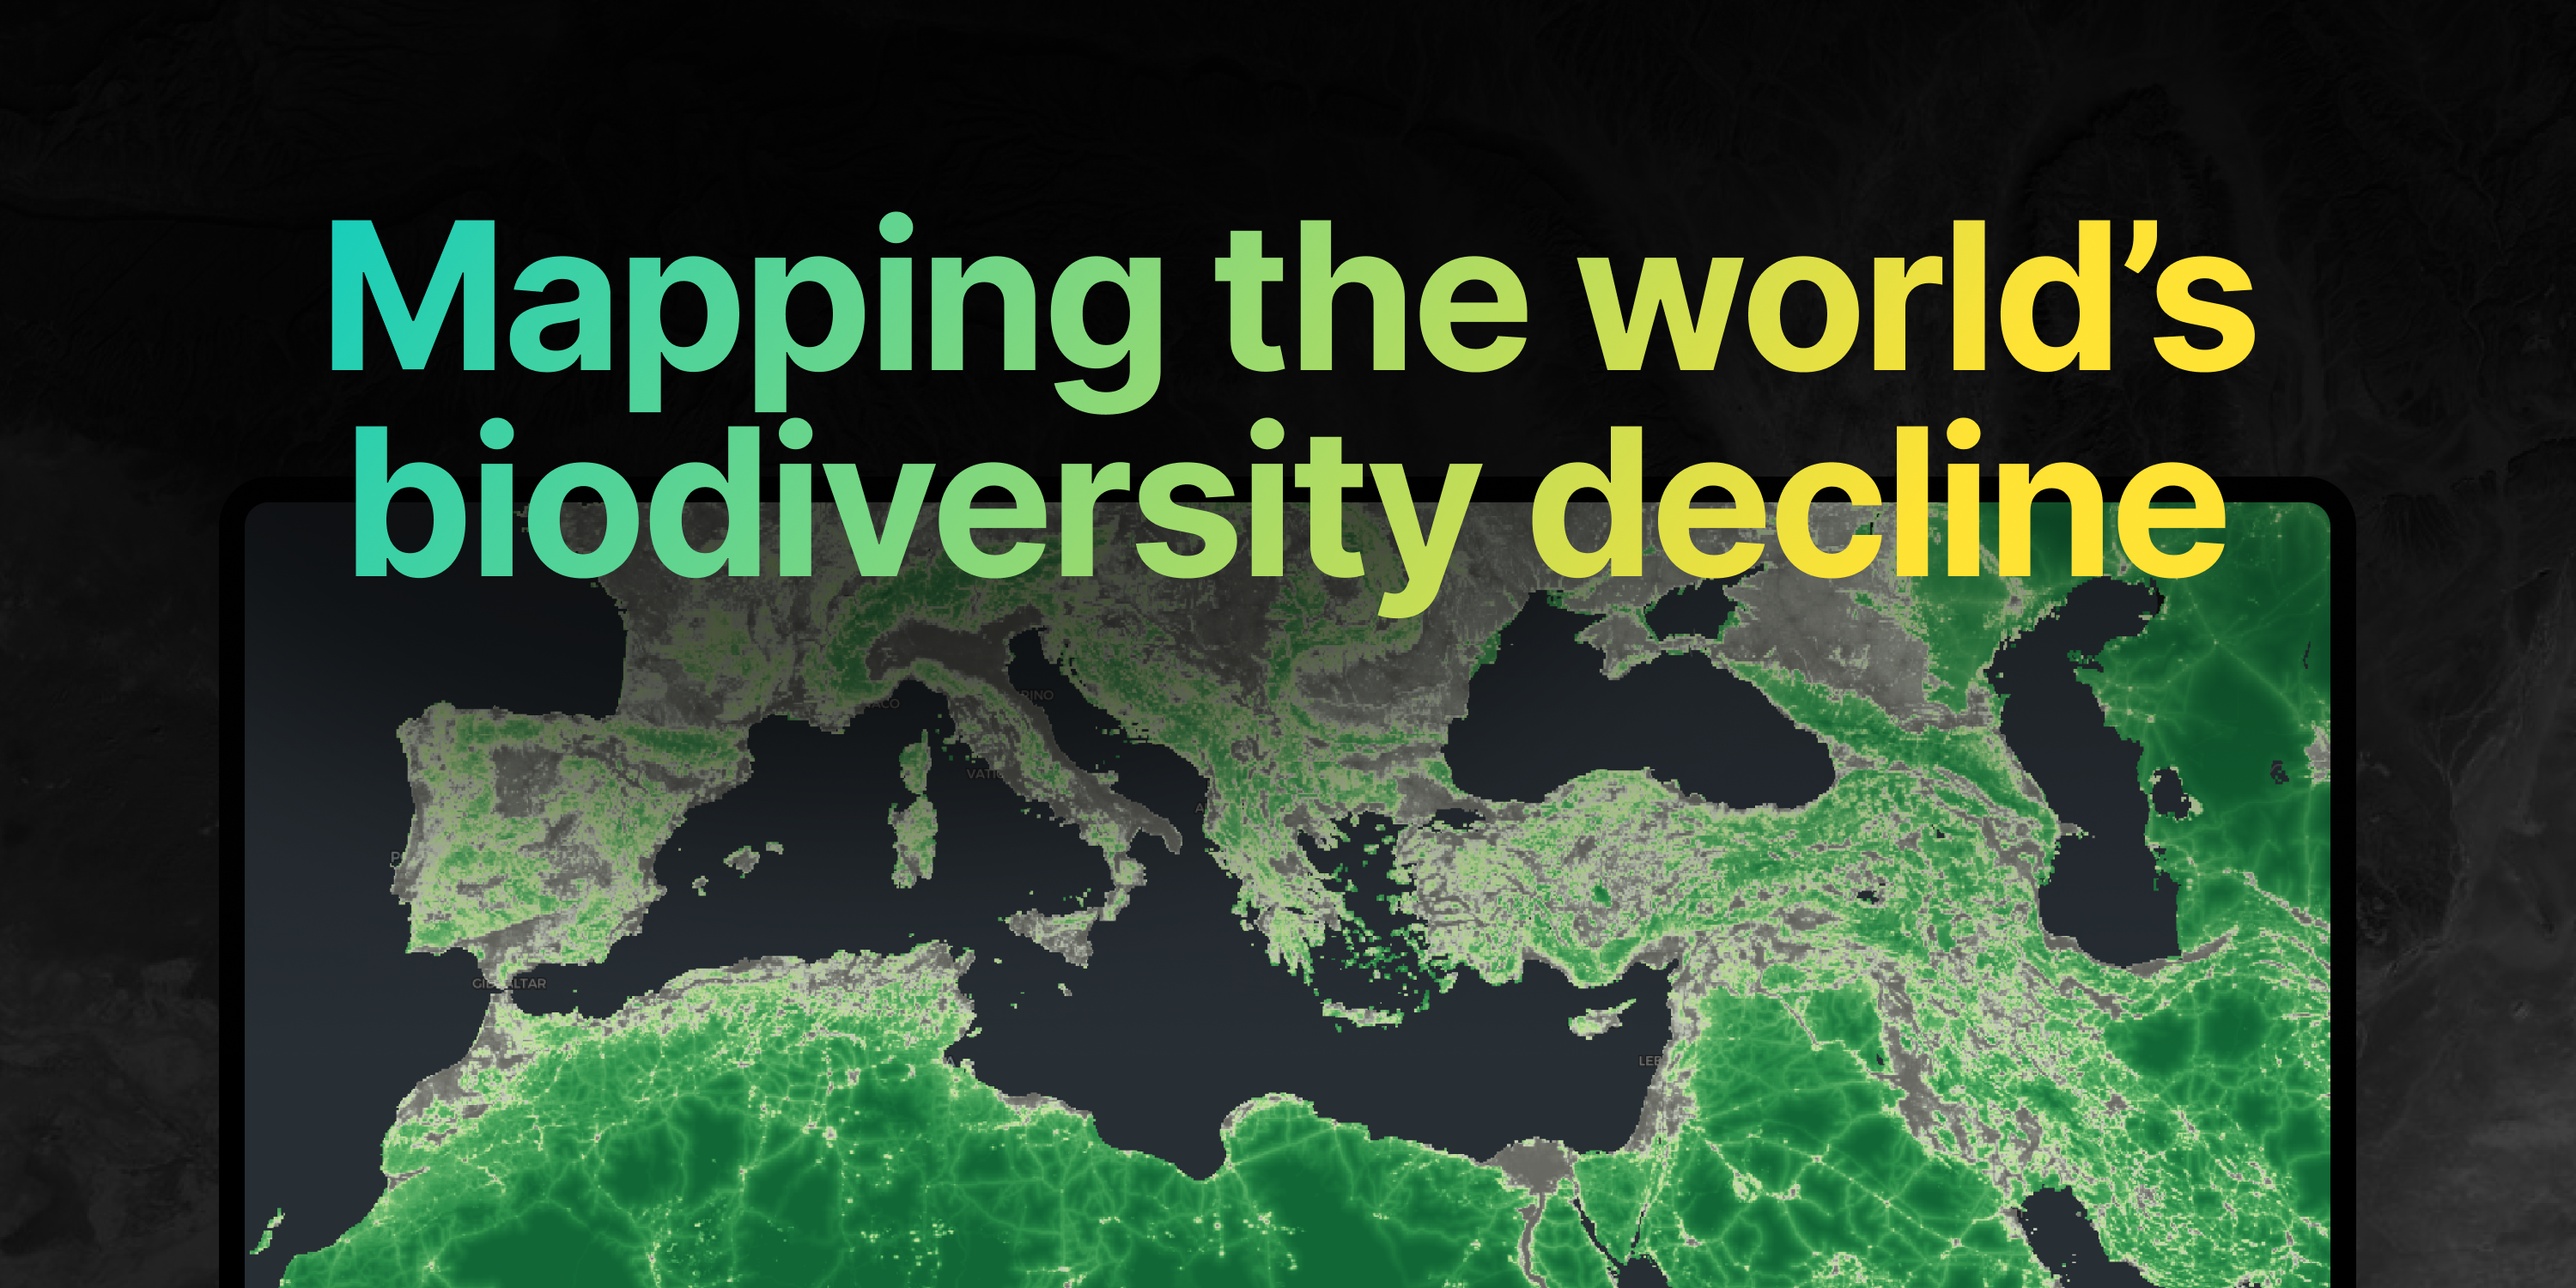
Today, Vizzuality and Impact Observatory released the Global 100m Biodiversity Intactness Dataset (v1.1), extending its high-resolution spatial time series through 2025. When it first launched, the index covered the years 2017 to 2020. As of today, the dataset expands to nine continuous years from 2017 to 2025 providing a free and consistent alternative aligned with established global benchmarks.
Indicators of biodiversity are essential for planning, monitoring, conserving and restoring the world’s biodiversity. This updated dataset provides private and public stakeholders alike with a standardized, site-level metric to locate exactly where human pressures have degraded biodiversity over the past nine years, helping them align with frameworks such as the Taskforce for Nature-Related Financial Disclosures (TNFD) and the EU Corporate Sustainability Reporting Directive (CSRD).
Despite the urgency of halting biodiversity loss, global, openly accessible data remains scarce. In fact, a lack of access to Nature data is one of the biggest barriers holding back corporate accountability and stopping governments from achieving their global biodiversity targets.
Why we build open nature data
At Vizzuality, we know that access to environmental data remains one of the largest bottlenecks for action. Many existing biodiversity datasets are held proprietarily or restricted by non-commercial licenses. This creates unnecessary hurdles where companies, contractors, and researchers tasked with assessing nature risk are blocked from accessing the data they need.
By producing this dataset and extending this time series through 2025, we provide a consistent baseline for independent researchers, NGOs, or sustainability practitioners to download and integrate the data directly into their own work.
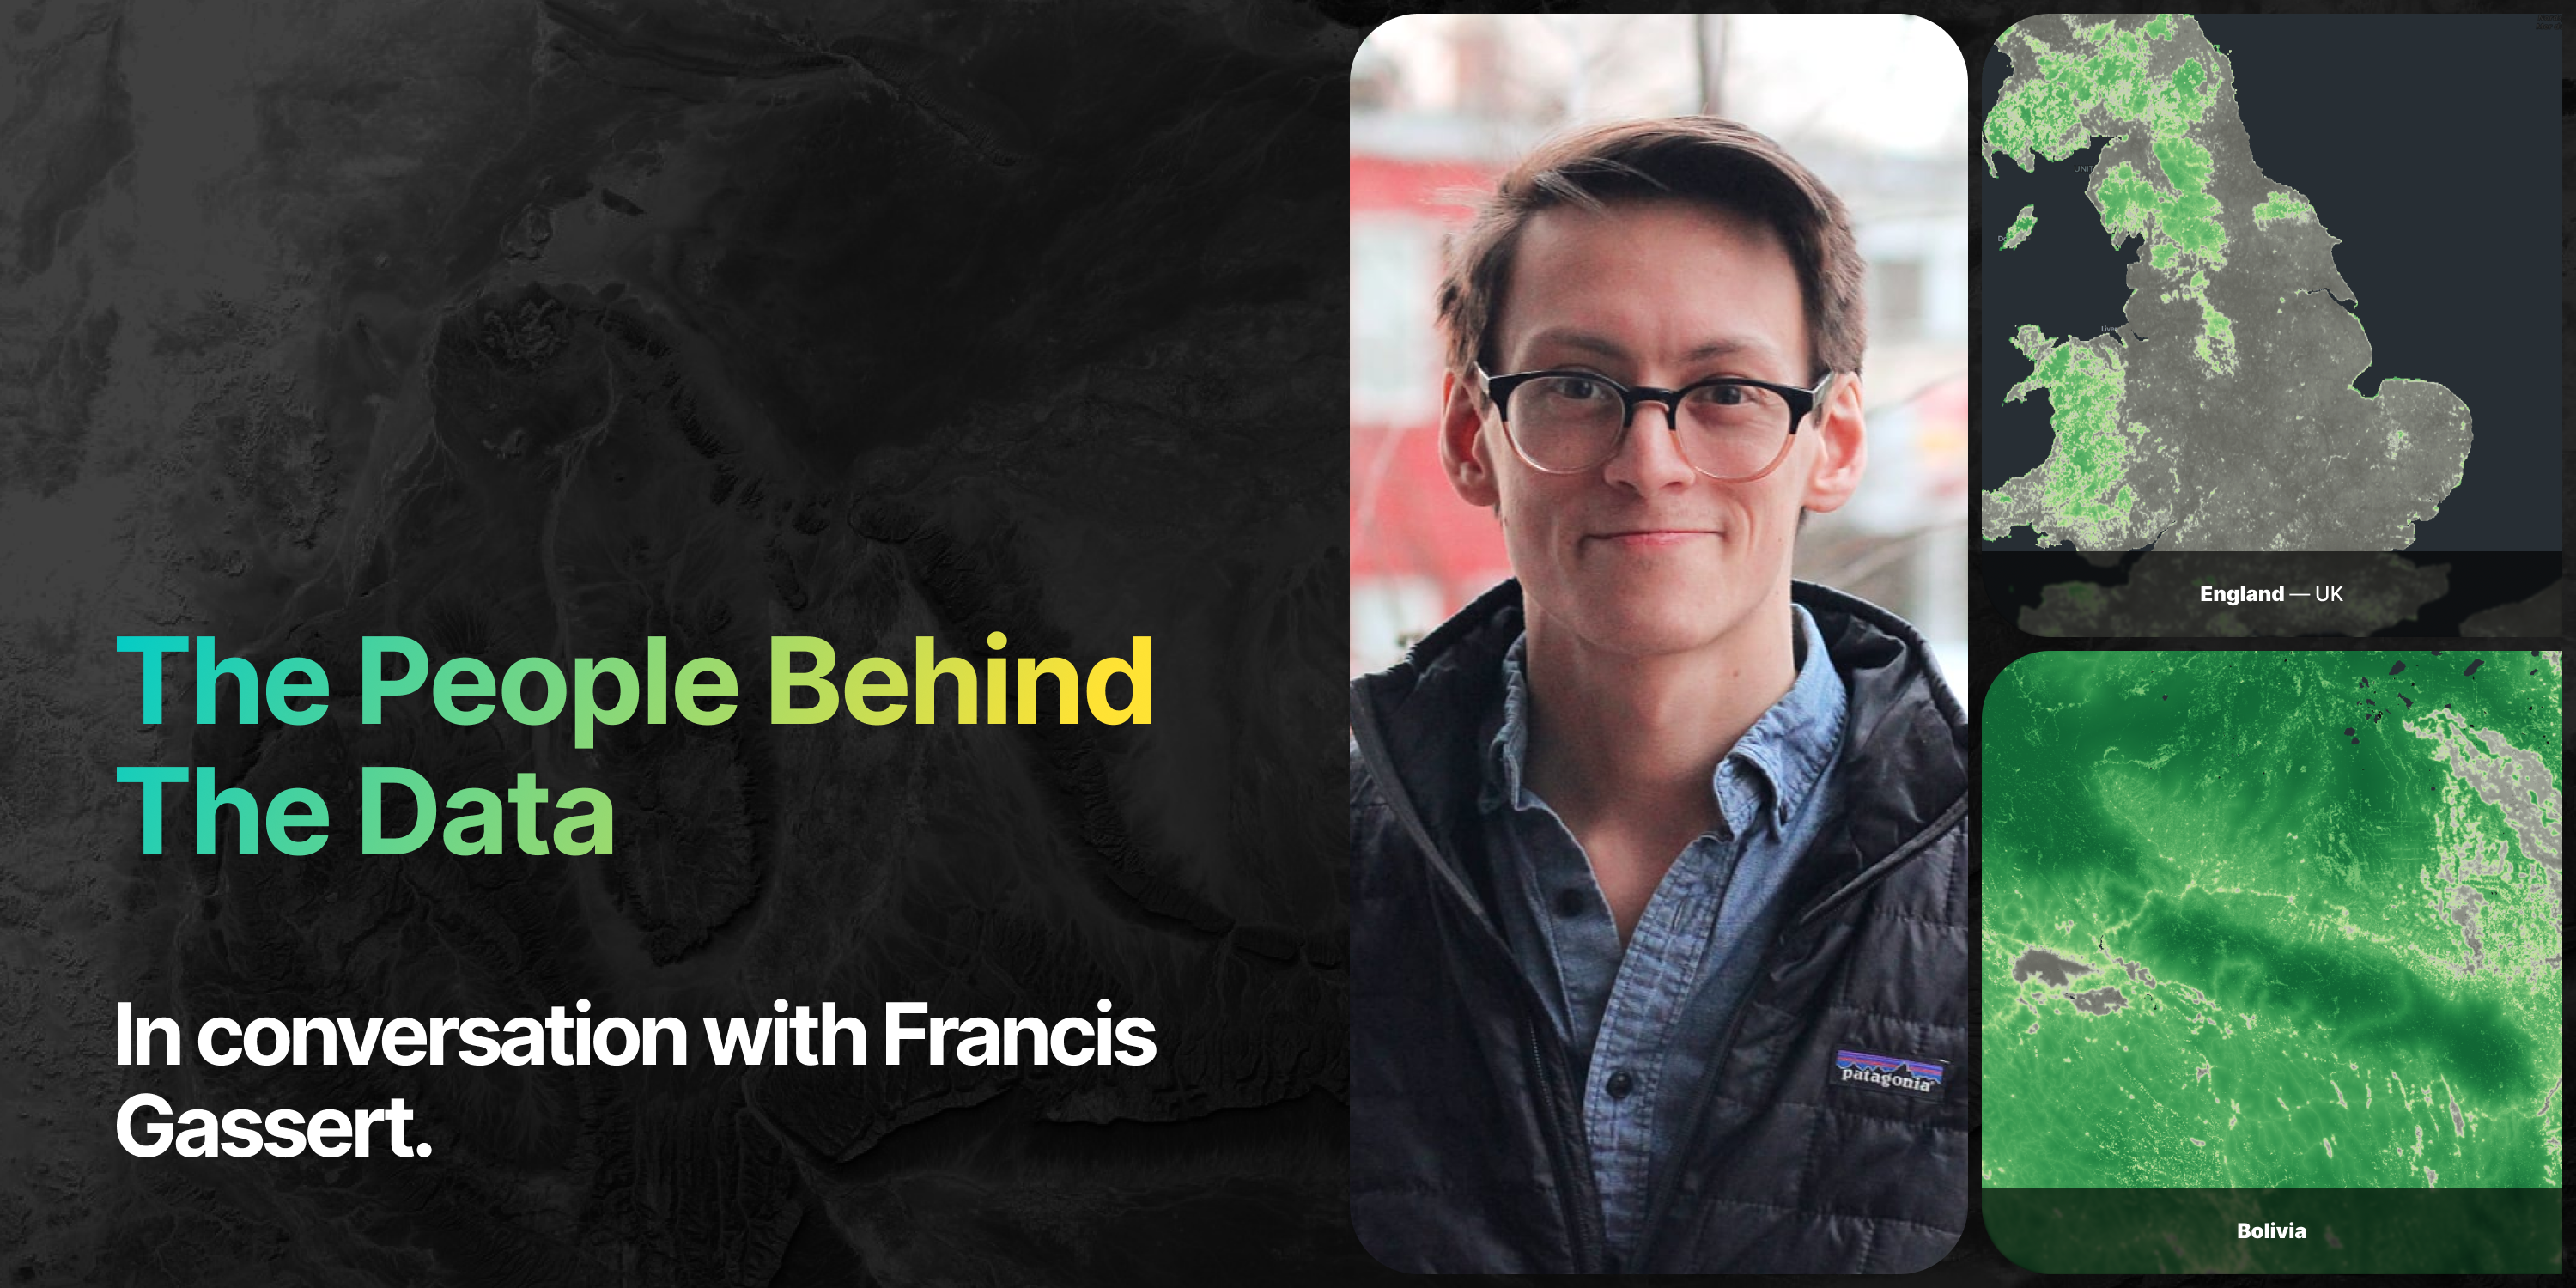
"Open accessible data is one of the greatest catalysts for change. This was demonstrated by Global Forest Watch, where the ability for anyone to see where trees are cut down created accountability, then voluntary corporate commitments on deforestation, and finally the political confidence for the EU Deforestation Regulation to insist on deforestation free supply chains. By publishing this dataset openly, we’re challenging the nature sector to do the same.” explains Francis Gassert, lead author at Vizzuality.
What the data reveals: 4 million km2 shifted into degradation.
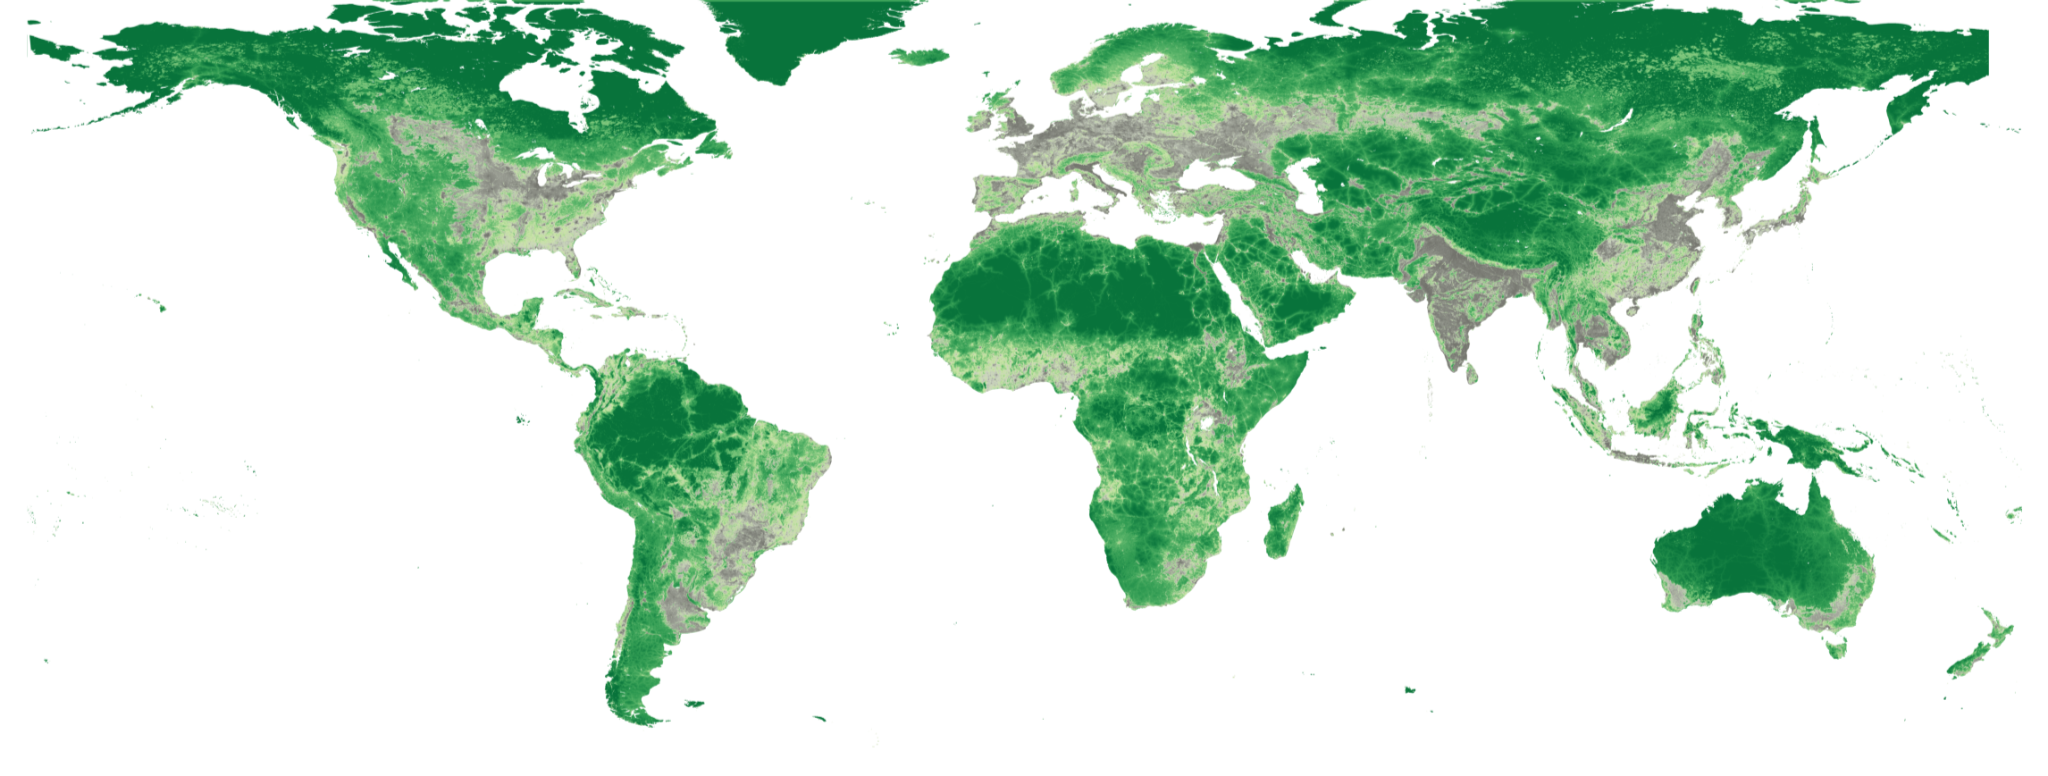
By extending the dataset through 2025, we were able to map hotspots of change across the globe and identify key patterns of biodiversity degradation:
- Approximately 3% of global land area (~4 million km2) transitioned from relatively intact states (scores >0.90) into degraded territory (scores <0.90). That is an area larger than India moving into a degraded state in just eight years.
- While conservation efforts often center on forests, the map also highlights biodiversity loss in grassland and rangeland ecosystems.
- Global agricultural expansion is a primary driver of biodiversity loss globally, driven by demand for animal feed and food products, as well as biofuels. The conversion of intact ecosystems into crop lands is visible in the map on every continent.
What does a declining score mean?
Biodiversity Intactness gives an indication of how much of a region’s biodiversity is remaining expressed as a number between 0–1, where 1 represents the most intact ecosystems and 0 the most degraded.
While we can’t count individual species in satellite imagery, patterns of human pressures such as expanding agriculture, urbanization, and deforestation are readily visible. Biodiversity Intactness looks at how these patterns are associated with changes in biodiversity based on thousands of site-level observations worldwide gathered in the London Natural History Museum’s PREDICTs database. More specifically, it evaluates changes in Abundance or the quantity of individuals and Composition, how similar the species are to nearby intact baseline.
The resulting maps give a high resolution global picture of how human activities are affecting the natural world.
.gif)
How practitioners can use this data today
At the strategic level, the global view enabled by the dataset is exactly what public and private sector leaders need to target their efforts and take urgent action to halt biodiversity loss.
On the private side, companies working on aligning their business activities with the requirements of CSRD (The Corporate Sustainability Reporting Directive) or reporting on their nature-related dependencies for TNFD (The Taskforce on Nature-related Financial Disclosures) can quickly assess global operations to identify sensitive locations and areas where dependence on nature may be a material risk, prior to investing in collecting site level data.
On the public side, NGOs, government agencies and policy makers could use the data to inform understanding of where and how quickly biodiversity is declining, as well as contextualize conservation and restoration action. For example, the dataset could help them identify high-intactness baseline habitats that require immediate protection versus degraded zones where ecological restoration and regeneration is paramount. In both cases, it’s important to remember that the dataset provides a global estimate, and not a replacement for field-level monitoring.
...
Thank you to the authors of “Global 100m Projections of Biodiversity Intactness for the Years 2017–2025”, Francis Gassert, Joe Mazzarello, and Samantha Hyde.
- Link to the open-access dataset.
- Link to the methodology paper.
- Link to the source code.
- Access the map.